Healthcare dashboard for a National Healthcare perspective
- 3 mins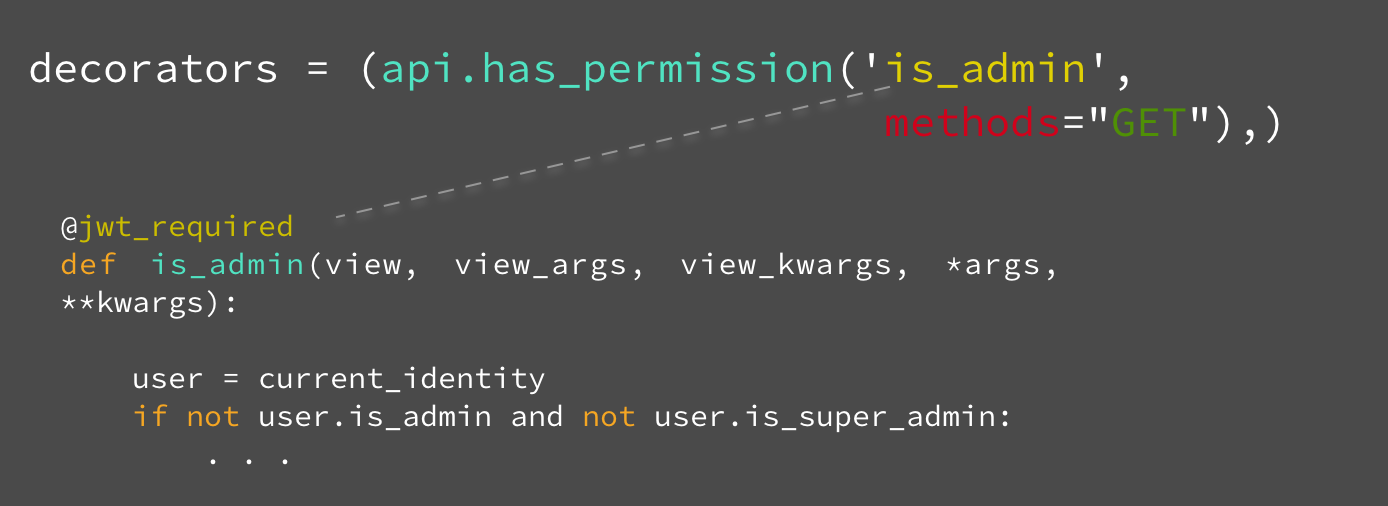 A guide to use Permission Manager in Open Event API Server
According to an independent survey, around 2000 lives have been lost in the last 5 years because of improper resource allocation of healthcare resources across the U.S. Understanding gravity of the situation, we developed a comprehensive dashboard using the Healthcare database while assuming the role of National Health Group Management to help prevent such mishaps. Taking into consideration the restrictions present in dataset, we imagined the whole situation as a case of ‘Supply-Demand’ wherein, demand relates to the number of visits to medical service providers, while Supply includes the necessary logistics to take care of the ailment (ex. Specialist doctors, equipment, drugs). The dataset contains many of the demand side parameters, but it lacks any supply side information to take necessary actions. For the purpose of this comprehensive dashboard, we are assuming that the diagnosis offered by provider is for the disease with which the patient is actually suffering from (in reality, diagnosis offered may not target the actual ailment). The arrangement of our dashboards & sheet is as follows:
1. Overview
This dashboard can be used to provide a comprehensive look into all the major vitals including Time Spent with Provider, male-female ratio, most prevalent Diagnosis offered & the corresponding drugs prescribed in a state-wise granularity. Using this, one can immediately estimate which state is suffering from which ailment and who are the most hit by it.
2. Diagnosis
This dashboard can be used to assess the present condition from the diagnosis offered perspective. It showcases different most common healthcare providers & age categories in race-wise granularity. Using this, one can observe which drugs are most prescribed for a particular diagnosis along with the common reasons for visit.
The interesting part is that by default it uses <*id> *from view_kwargs to get the resource from the model but in any case if there is no specific ID with name
1. **f****etch_key_url (string): **This is the name of the key whose value will be fetched from view_kwargs and will be used to match through the records in database model to get the resource.

2. **f****etch_key_model (string):** This is the name of the match column in the database model for the **fetch_key_url**, The value of it will be matched with column named as the value of **fetch_key_model.**
In case there is no record found in the model then permission manager will throw NotFound 404 Error.
3. State
This dashboard can be used to assess the present condition from the state perspective. It includes the likes of average time spent with provider, monthly visitation trends to different providers and payer type distribution in race-wise granularity. Using this, one may find that a particular provider is taking too much time when compared to national average & hence, slowing down the treatment lifecycle because of it.
def **has_access**(access_level, **kwargs):
**if **access_level **in **permissions:
   auth = permissions[access_level](**lambda ***a, **b: True, (), {}, (), **kwargs)

   **if **type(auth) **is **bool **and **auth **is **True:

       **return **True
**return **False
4. Forecast Sheet
This sheet is included to provide an idea about how predictions as per definite diagnosis type in a particular state for a time frame can be made. It also includes upper 95% level to showcase the worst-case scenario – the time period one can expect an outbreak to occur in a state. Once the supply side information (availability of no. of doctors, equipment and medication to care of the ailment) is known, the administration can tread cautiously during those time frames.
The visualizations in current form offer valuable insight as is but would benefit even more if we have supply side information that would help us, as National Health Manager, to take decisions in order to ensure proper working of the system as well as prepare/prevent any foreseeable catastrophe. The results can be used for proper resource allocation that can help all three links in healthcare – Payer, Provider & Patient, immensely. In conclusion, our dashboards can help in proper functioning of a healthcare system by overseeing both current as well as future demand.

Archit Gupta
An analytical being in this not so analytical world